- Manufacturing planning whose delivery date is the earlier,
- Treatment of basic necessities (hardware control, obtaining approval etc..
- Forecast shares of the shortest and with the least length with another task.
- Forecasting activities from simple to more complicated.
- Planning of the remaining shares until completion of the project …
The rules are varied depending on the type of actions to be taken:
- Monitoring study schedule, sports, production
- Followed the same project for different customers
- Competitive multi-vendor (methodology, expertise, time, experience …)
- Multiple projects (construction of a building, presentation in several geographic areas …)
- Observation of time not to exceed critical
- Business plan (marketing, finance, management …)
- Comparison (percentages, cost, components …)
- Managing multiple projects including sometimes perform identical tasks at the same time …
- Engineering supervision in parallel with production
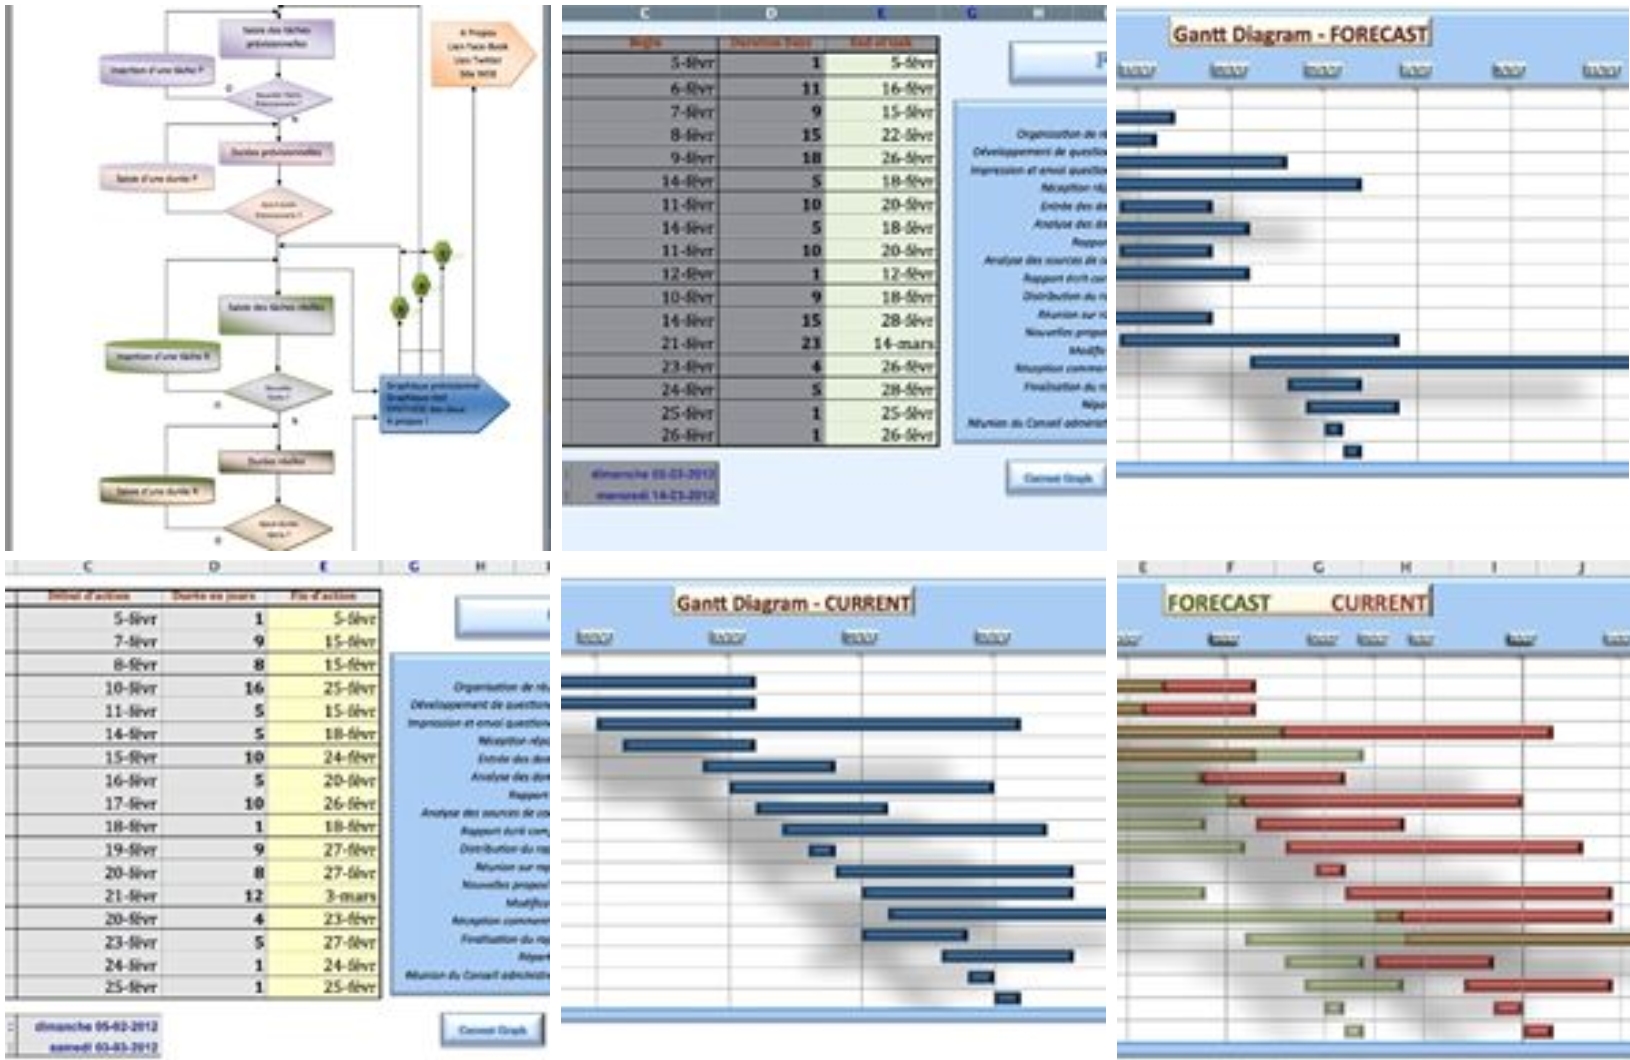
And many more ![]() You can see the sequence of logical tables and graphs developed my version of Excel and compatible PC and MAC on our FB page … Whether in my studio making missions or marketing, finance or management, a large number of different cases were discussed throughout my career and I am happy to share with those who ask me
You can see the sequence of logical tables and graphs developed my version of Excel and compatible PC and MAC on our FB page … Whether in my studio making missions or marketing, finance or management, a large number of different cases were discussed throughout my career and I am happy to share with those who ask me ![]() I also give training on “data Vizualisation” which charts to what data? What tools for what results … soon … Comments are those of the author, if inadvertently you notice an error or misinterpretation, do not hesitate to let me know. David Mesmacque Recreation: “An intellectual is a man who uses more words than necessary to tell more than he knows. “Dwight Eisenhower Valid for all makers, General Dwight Eisenhower elaborated a” matrix called Eisenhower “he used 6 June 1944 to lead the largest invasion force of all time:” Operation Overlord “parachuting and landing Allied forces in Normandy. This matrix allows me to visualize in order of importance and urgency, depending on how the various actions that I must “place” in my Gantt chart, here summarized: These two criteria easily interpretable, can decide what should be prioritized:
I also give training on “data Vizualisation” which charts to what data? What tools for what results … soon … Comments are those of the author, if inadvertently you notice an error or misinterpretation, do not hesitate to let me know. David Mesmacque Recreation: “An intellectual is a man who uses more words than necessary to tell more than he knows. “Dwight Eisenhower Valid for all makers, General Dwight Eisenhower elaborated a” matrix called Eisenhower “he used 6 June 1944 to lead the largest invasion force of all time:” Operation Overlord “parachuting and landing Allied forces in Normandy. This matrix allows me to visualize in order of importance and urgency, depending on how the various actions that I must “place” in my Gantt chart, here summarized: These two criteria easily interpretable, can decide what should be prioritized:
- 1. Urgent, Important: Activity decisive (immediate action)
- 2. Non-urgent Important: Objectives large (say Activity anticipation, important but sometimes occupying a considerable time and it is therefore necessary to manage)
- 3. Urgent, but not important Interruption (which are often the cause of a discrepancy between the estimated and actual)
- 4. No not urgent & important Distraction (to put on hold or to remove or simply to achieve if time saved on the real, should not interfere with the dead-line initially planned)